The Drink-from-the-Tap Standard: Tokyo, Singapore, Copenhagen Did It. India's Roadmap.
Tokyo, Singapore, and Copenhagen achieved tap water you can drink without filtering or boiling. India's 70% urban boil-rate reveals the infrastructure gap. Here is how those cities built safe tap water, what India's pipeline looks like, and five citizen actions to accelerate the standard.
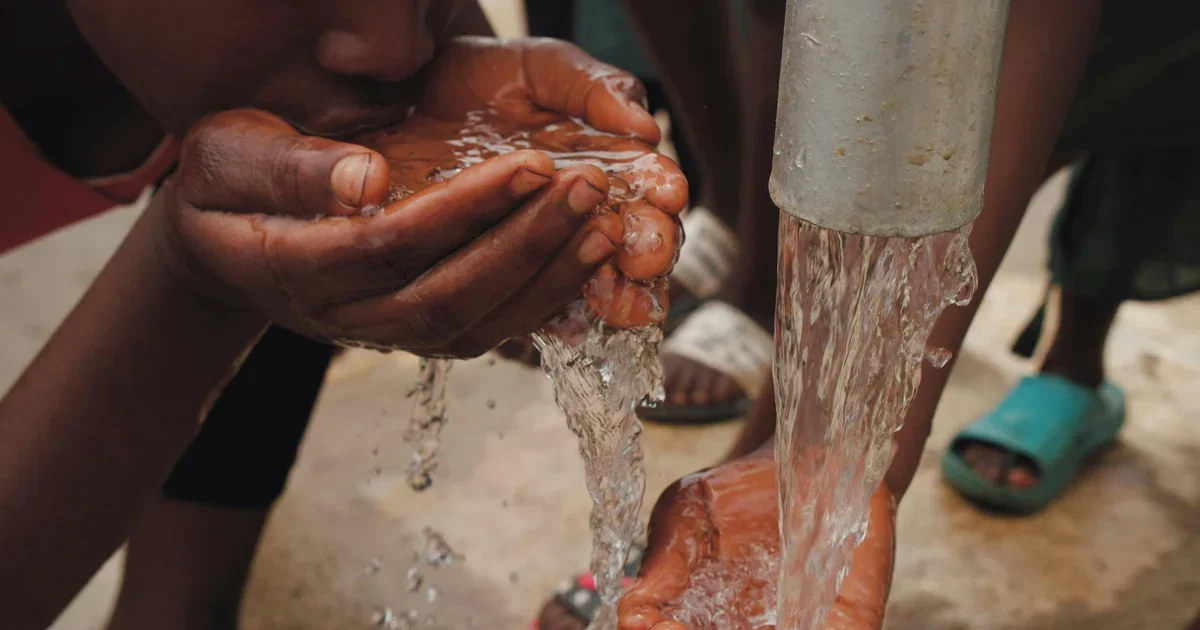
The Drink-from-the-Tap Standard: Tokyo, Singapore, Copenhagen Did It. India’s Roadmap.
When a visitor lands in Tokyo, Singapore, or Copenhagen, one of the first things they notice is how casually locals drink water straight from the tap. No boiling. No filter pitcher waiting on the kitchen counter. No hesitation. That act, filling a glass at a kitchen sink and drinking it without a second thought, is one of the clearest, least-discussed markers of what separates developed infrastructure from developing infrastructure.
In India, 70% of urban households still boil or filter their tap water before drinking it. That single statistic, buried in consumer surveys and public health reports, tells you more about where India’s infrastructure actually stands than any GDP headline or smart-city brochure.
This article traces how three cities built potable tap water at scale, identifies the exact gap India must close, and maps the policy levers already in motion, and those still missing.
Why Tap Water Is a Civilisational Metric
The ability to drink tap water safely is not merely a matter of convenience. It is the downstream output of a complete infrastructure stack: source water quality, treatment technology, pipe material and age, distribution pressure, last-mile contamination prevention, and real-time monitoring. Every link in that chain must hold simultaneously.
The World Health Organisation defines safe drinking water as water free from microbial contamination (E. coli, cryptosporidium), chemical contamination (arsenic, fluoride, nitrates above threshold), and turbidity. Achieving and sustaining this across an entire city, not just from the treatment plant output but at the consumer’s tap, requires institutional continuity that most Indian cities have not yet achieved.
The economic stakes are substantial. The WHO estimates that every US$1 invested in safe water and sanitation yields US$4 in economic benefits globally, primarily through reduced healthcare costs, lost workdays, and productivity. India’s Central Pollution Control Board (CPCB) data shows that waterborne diseases, diarrhoea, typhoid, hepatitis A, account for over 37.7 million cases annually. The NITI Aayog Composite Water Management Index (2019) flagged that 21 major cities would reach critical groundwater stress by 2020. Several already have. This burden falls hardest on those who cannot afford private alternatives, as examined in the context of why rural Indians pay more than Swedes for healthcare, the out-of-pocket cost of waterborne illness treatment represents a regressive tax on India’s poorest urban residents.
How Tokyo Did It: A Century of Engineering Discipline
Tokyo’s tap water is so clean that the Tokyo Waterworks Bureau actively promotes it as a product. The bureau runs a bottled version called “Tokyo Water” sold at vending machines, municipal tap water in a bottle, and tourist brochures describe the water as “among the world’s best tasting.”
This did not happen overnight. Tokyo’s modern waterworks system was built after the 1886 cholera epidemic killed over 100,000 people in Japan in a single year. The Meiji government commissioned British engineer Henry Burton to design a piped water system. The first modern waterworks opened in 1898. Over the following century, Tokyo layered on:
- Multi-stage treatment: Coagulation, sedimentation, filtration, advanced ozone treatment, and biological activated carbon (BAC) filtration to remove taste, odour, and micro-pollutants.
- Pipe replacement programme: Tokyo replaced lead pipes citywide and has ongoing schedules to replace aging cast-iron pipes with polyethylene. As of 2022, over 98% of Tokyo’s distribution network uses corrosion-resistant materials.
- Pressure management: Tokyo maintains positive pressure throughout its distribution system, meaning water flows outward at every junction, preventing backflow contamination.
- Real-time monitoring: Over 5,000 automated water quality monitoring points across the network relay data continuously to the bureau’s central command. Anomalies trigger automatic alerts.
- Customer transparency: Tokyo publishes daily water quality test results, over 50 parameters, publicly online. Any resident can look up yesterday’s turbidity and residual chlorine reading at their nearest monitoring point.
The result: Tokyo’s tap water meets Japan’s national drinking water standards, which are stricter than WHO guidelines on 26 of 51 measured parameters.
Singapore’s PUB Model: From Water Crisis to Water Abundance
Singapore’s water story begins with existential scarcity. When Singapore separated from Malaysia in 1965, it was almost entirely dependent on Johor for water. Lee Kuan Yew described water security as Singapore’s most critical vulnerability. The country responded with one of the most disciplined and comprehensive water infrastructure programmes in the world.
Singapore’s Public Utilities Board (PUB) manages what it calls the “Four National Taps”: local catchment water, imported water (from Johor, under treaty until 2061), NEWater (highly treated reclaimed water), and desalination. The entire island is now a water catchment area, 17 reservoirs, two-thirds of the land surface.
For tap water specifically, the PUB system works as follows:
Treatment: Water is treated at one of nine water treatment plants using conventional multi-stage treatment plus membrane filtration. The Chestnut Avenue Water Treatment Plant, the largest in Southeast Asia, can produce 750 million litres per day.
Distribution: Singapore maintains an Asset Management System that tracks every pipe segment’s age, material, pressure history, and leak record. The Non-Revenue Water rate (water lost to leakage before reaching consumers) is under 5%, compared to 30-50% in most Indian cities.
Monitoring: PUB deploys an “intelligent water grid”, smart meters, pressure sensors, and water quality sensors throughout the distribution network. The system detects and isolates leaks within hours. Bacteria and turbidity are monitored at 140 points continuously.
Regulation: Singapore’s Environmental Public Health Act mandates that all new buildings use water-efficient fittings. Plumbers must be PUB-licensed. Any building found with contaminated water faces mandatory investigation and repair at owner’s cost.
Singapore has not had a waterborne disease outbreak linked to drinking water in over three decades. PUB’s Tap Water Quality Report, published annually, shows consistent compliance on all 285 parameters tested.
Copenhagen’s Groundwater Miracle: Quality Through Source Protection
Copenhagen takes a fundamentally different approach from Tokyo and Singapore. Rather than building elaborate treatment systems to fix contaminated source water, Copenhagen protects its groundwater sources with the same seriousness it would a national park.
Denmark draws over 99% of its drinking water from groundwater, one of the highest rates in Europe. The water is so naturally clean that treatment requires only aeration (to remove iron and manganese) and a modest filtration step. No chlorination is used in Danish drinking water. Consumers taste the water as it arrives from the aquifer, with mineral profile intact.
The reason this works: Denmark has maintained strict pesticide-free zones around groundwater recharge areas since the 1980s. Industrial discharge standards are stringent. Agricultural runoff is regulated. PFAS contamination, a crisis across much of the US and parts of Europe, is actively monitored and remediated in Denmark at public expense.
The lesson for India from Copenhagen is about upstream decisions, not downstream treatment. Groundwater quality protection, preventing contamination before it reaches aquifers, is far cheaper than treating it out afterward.
India’s Gap: The 70% Problem
Against this backdrop, India’s urban water picture is sobering.
According to the NITI Aayog Ease of Living Index and CPCB river water quality reports:
- 70% of urban Indian households boil or filter tap water before drinking, according to consumer surveys and independent public health research.
- Only 3 of 30 major Indian cities provide water for more than 12 hours a day continuously. The rest provide intermittent supply, meaning pipes run dry and then refill, creating negative pressure windows where ground-level contaminants can infiltrate.
- Non-Revenue Water losses average 30-50% in Indian cities (compared to Singapore’s under 5%), meaning infrastructure aging, illegal connections, and metering failures waste nearly half the treated water before it reaches consumers.
- Lead pipe legacy: Many Indian cities, particularly in older neighbourhoods, still have lead service lines or galvanised iron pipes installed in the 1950s-1980s. Lead leaches into water at rest in old pipes. There is no national pipe replacement mandate.
- Last-mile contamination: Even where treatment plant output meets standards, rooftop storage tanks (overhead tanks on Indian buildings) are rarely cleaned regularly. Water that leaves the plant clean can become contaminated in a dirty storage tank before reaching the tap.
- The CPCB 2022 report on river water quality found that 311 river stretches across India were critically polluted, the same rivers that supply municipal water intakes.
The Jal Jeevan Mission (JJM), launched in 2019, has achieved significant progress on rural tap connections: over 140 million rural households connected by 2024. But JJM’s mandate is connection, not quality certification at the tap. A household can be JJM-certified “connected” while still receiving water that requires boiling.
The AMRUT 2.0 scheme (Atal Mission for Rejuvenation and Urban Transformation) has allocated approximately Rs 2.77 lakh crore for urban infrastructure with a significant water supply component. By 2024, AMRUT 2.0 had issued project sanctions worth Rs 66,000 crore for water supply across 500+ cities. The scheme includes 24×7 water supply as a target. Progress has been uneven, Pune and Nagpur have implemented 24×7 zones; most smaller AMRUT cities have not.
What India’s Cities Must Build: A Five-Layer Stack
To reach the Tokyo-Singapore-Copenhagen standard, Indian cities need to build five layers simultaneously:
Layer 1: Source Protection
Source water quality determines treatment cost and feasibility. Cities dependent on critically polluted rivers (Yamuna in Delhi, Mula-Mutha in Pune, Cooum in Chennai) must invest in upstream sewage treatment to reduce organic load before water reaches intakes. Without source protection, treatment plants fight a permanently losing battle.
Layer 2: Treatment Upgrade
Most Indian water treatment plants use conventional treatment (coagulation-flocculation-sedimentation-filtration-chlorination), designed in the 1970s for different contamination profiles. Emerging contaminants, pharmaceuticals, PFAS, microplastics, are not addressed by conventional treatment. A phased upgrade to advanced oxidation and membrane filtration is needed for metro cities.
Layer 3: Continuous Pressurised Distribution
Intermittent supply is the single biggest driver of tap water contamination in India. When pipes run at zero or negative pressure, ground contamination enters through joints and cracks. The shift to 24×7 continuous pressurised supply, which Nagpur has demonstrated is technically and financially feasible, is the most impactful single intervention.
Layer 4: Pipe Replacement
A national audit of water distribution pipe material and age, followed by a phased replacement mandate for lead and pre-1980 galvanised iron pipes, is essential. Delhi’s Jal Board estimates over 10,000 km of its distribution network needs replacement. This is not glamorous infrastructure, it is underground and invisible, but it is the proximate cause of much tap water contamination.
Layer 5: Real-Time Monitoring and Public Transparency
Tokyo’s 5,000 monitoring points and Singapore’s intelligent water grid both rest on the same foundation: real-time data, publicly accessible. India’s Bureau of Indian Standards (BIS) mandates quarterly tap water testing under IS 10500. Quarterly is not adequate for a dynamic system. Continuous monitoring with public dashboards, available at the ward level, is the transparency standard Indian cities should build toward.
Policy Levers: What Is Already in Motion
JJM + AMRUT 2.0 Convergence: The Ministry of Jal Shakti has acknowledged the need to link JJM’s rural connectivity with urban quality outcomes. A formal convergence framework, where JJM rural connections feed into AMRUT 2.0 quality auditing in peri-urban areas, would close a current institutional gap.
City Water Audits: The National Water Mission framework allows states to mandate city-level water audits. Maharashtra, Karnataka, and Rajasthan have begun water audit frameworks for their AMRUT cities. Scaling this to all 500 AMRUT cities and publishing results publicly is a near-term achievable step.
Star Rating for Water Utilities: The Ministry of Jal Shakti piloted a “Star Rating” programme for urban water utilities in 2022, modelled on Singapore’s PUB performance benchmarks. Utilities were rated on non-revenue water, water quality compliance, coverage, and continuity. Expanding this programme and linking ratings to funding allocation would create performance incentives.
India Water Quality Index: NITI Aayog’s Composite Water Management Index has existed since 2018 but focuses on groundwater and source availability rather than tap water quality at the consumer level. A dedicated tap water quality index, tested at household level, published annually by city, would be a powerful accountability tool.
What You Can Do: Citizen Action at Every Level
Systems change when citizens demand accountability at specific points. Here are actions every urban resident can take, from the personal to the national level:
- Test your tap water. BIS-accredited labs in every major city offer drinking water tests for Rs 500-2,000 covering 40+ parameters. Results from individual households, when aggregated by RWA or ward, create evidence for utility accountability.
- Demand RWA audits. Resident Welfare Associations have the standing to formally request water quality reports from their municipal water utility. Under RTI, water quality test results are disclosable public information. An RWA filing a quarterly RTI for ward-level water test data creates a feedback loop utilities cannot ignore.
- Report discolouration or odour immediately. Most city water utilities now have mobile apps or helpline numbers. Every complaint logged becomes a data point in the utility’s quality management system. Silence is interpreted as satisfaction.
- Clean building storage tanks annually. Rooftop tank contamination is the homeowner’s responsibility. Annual cleaning and quarterly chlorination of building overhead tanks removes the last-mile contamination that utilities cannot control. This principle of residents managing their own building-level environmental conditions is well established in India’s urban adaptation toolkit.
- Hold your ward councillor accountable. When your ward councillor holds public meetings or office hours, ask specifically: “What is our ward’s average water supply hours per day, and what is your plan to reach 24×7?” Councillors respond to constituents who show up with specific questions rather than general complaints.
- Support national water transparency. Write to the Ministry of Jal Shakti and your state’s Water Resources department asking for a publicly accessible city-level tap water quality index, tested at household taps, published annually. Countries like Japan and Singapore have built public water dashboards as accountability tools. India can too, and citizen demand accelerates it.
The Standard India Is Building Toward
The Tokyo, Singapore, and Copenhagen examples share a common thread: political will sustained over decades, institutional continuity across administrations, and transparency that made underperformance visible and accountable.
India has the policy architecture, JJM, AMRUT 2.0, BIS standards, CPCB monitoring. What remains is the execution gap: intermittent supply to continuous, reactive monitoring to real-time, quarterly reporting to daily transparency, household boiling to direct drinking.
This is not a decade-long project. Nagpur demonstrated 24×7 water supply at city scale by 2017. Pune’s 24×7 zones serve hundreds of thousands already. The question is whether the model gets replicated to every AMRUT city by the 2026 target, and whether quality standards travel with it.
The drink-from-the-tap standard is not a luxury marker. It is a public health floor. When India’s cities can truthfully say that a resident can fill a glass from any kitchen tap and drink it without hesitation, that will mark the moment urban water infrastructure crossed a civilisational threshold, not just a percentage point in a government scheme report.
That moment is achievable. The roadmap exists. The gap is political will and implementation velocity.
Sources: Tokyo Waterworks Bureau Annual Report, PUB Singapore Annual Water Quality Report, Copenhagen Energi water quality data, CPCB River Water Quality Assessment 2022, NITI Aayog Composite Water Management Index 2019, WHO Guidelines for Drinking-water Quality (4th ed.), Ministry of Jal Shakti AMRUT 2.0 progress reports, Bureau of Indian Standards IS 10500:2012.
What you can do
- Get help nowTele-MANAS is the government's free tele-mental health helpline, in languages across states.Call 14416
- Share the evidenceSend this to one person who should know about health.Share on WhatsApp
- Give an afternoonTeach, mentor, clean up, or lend your professional skills.Ways to volunteer
- Tell us what's missingKnow a story, a fact we got wrong, or a solution worth spotlighting?Suggest a story
Politically neutral. Every claim sourced. Report a correction.

No comments yet