Reading India's Air Pollution Numbers: What AQI Means and Why Kanpur, Delhi and Patna Differ
How the CPCB AQI works, why the worst pollutant sets the number, and why Kanpur, Delhi and Patna readings differ, with 2025 data.
In this story
Short answer: air pollution levels in India are reported as an AQI, a single number from 0 to 500 that tells you how polluted the air is at one monitoring station. The Central Pollution Control Board (CPCB) works it out from the worst reading among up to eight pollutants, so one pollutant sets the number. Two cities can differ a lot because they have different weather, different local sources, different monitors and different mixes of pollutants. This guide explains the CPCB method and shows how to read air pollution levels in India, including why Kanpur, Delhi and Patna are not the same.
What AQI means for air pollution levels in India
The CPCB describes the Air Quality Index as a tool to tell people about air quality in terms that are easy to understand. It turns complex data on many pollutants into one number, one name and one colour.
There are six AQI categories: Good, Satisfactory, Moderately polluted, Poor, Very Poor and Severe. The CPCB sets each band from the concentration of pollutants and their likely health effects. These are called health breakpoints.
Category | AQI | PM10 (24-hour, µg/m³) | PM2.5 (24-hour, µg/m³) |
|---|---|---|---|
Good | 0 to 50 | 0 to 50 | 0 to 30 |
Satisfactory | 51 to 100 | 51 to 100 | 31 to 60 |
Moderately polluted | 101 to 200 | 101 to 250 | 61 to 90 |
Poor | 201 to 300 | 251 to 350 | 91 to 120 |
Very Poor | 301 to 400 | 351 to 430 | 121 to 250 |
Severe | 401 to 500 | Above 430 | Above 250 |
Source: CPCB, About National Air Quality Index. µg/m³ means micrograms per cubic metre of air.
The eight pollutants in the index
The CPCB built sub-indices and health breakpoints for eight pollutants that have short-term standards in India:
- PM10 (particles of 10 micrometres or smaller)
- PM2.5 (particles of 2.5 micrometres or smaller)
- Nitrogen dioxide (NO2)
- Sulphur dioxide (SO2)
- Carbon monoxide (CO)
- Ozone (O3)
- Ammonia (NH3)
- Lead (Pb)
Most monitoring stations do not measure all eight, and that is one reason cities differ. A station that measures only PM10, nitrogen dioxide and sulphur dioxide cannot show a PM2.5 spike.
How the AQI is calculated, step by step
- Measure. The station records each pollutant. For most pollutants the CPCB uses a 24-hour average. For carbon monoxide and ozone it uses an 8-hour average.
- Convert each pollutant to a sub-index. A sub-index is a linear function of the concentration. The CPCB gives an example for PM2.5: the sub-index is 51 at 31 µg/m³, 100 at 60 µg/m³ and 75 at 45 µg/m³.
- Pick the worst. The highest sub-index becomes the AQI for that location. The CPCB says it plainly: the worst sub-index determines the overall AQI.
- Check the data rules. The overall AQI is calculated only if data are available for at least three pollutants, and one of them must be PM2.5 or PM10. A sub-index needs at least 16 hours of data. Otherwise the data are treated as insufficient.
- Update in real time. The online system takes data from continuous monitoring stations without human intervention and shows a running average. The AQI at 6 am includes data from 6 am on the previous day.
A worked example
This example is our own calculation, using the CPCB breakpoints and its linear rule. It is not a reading from any station.
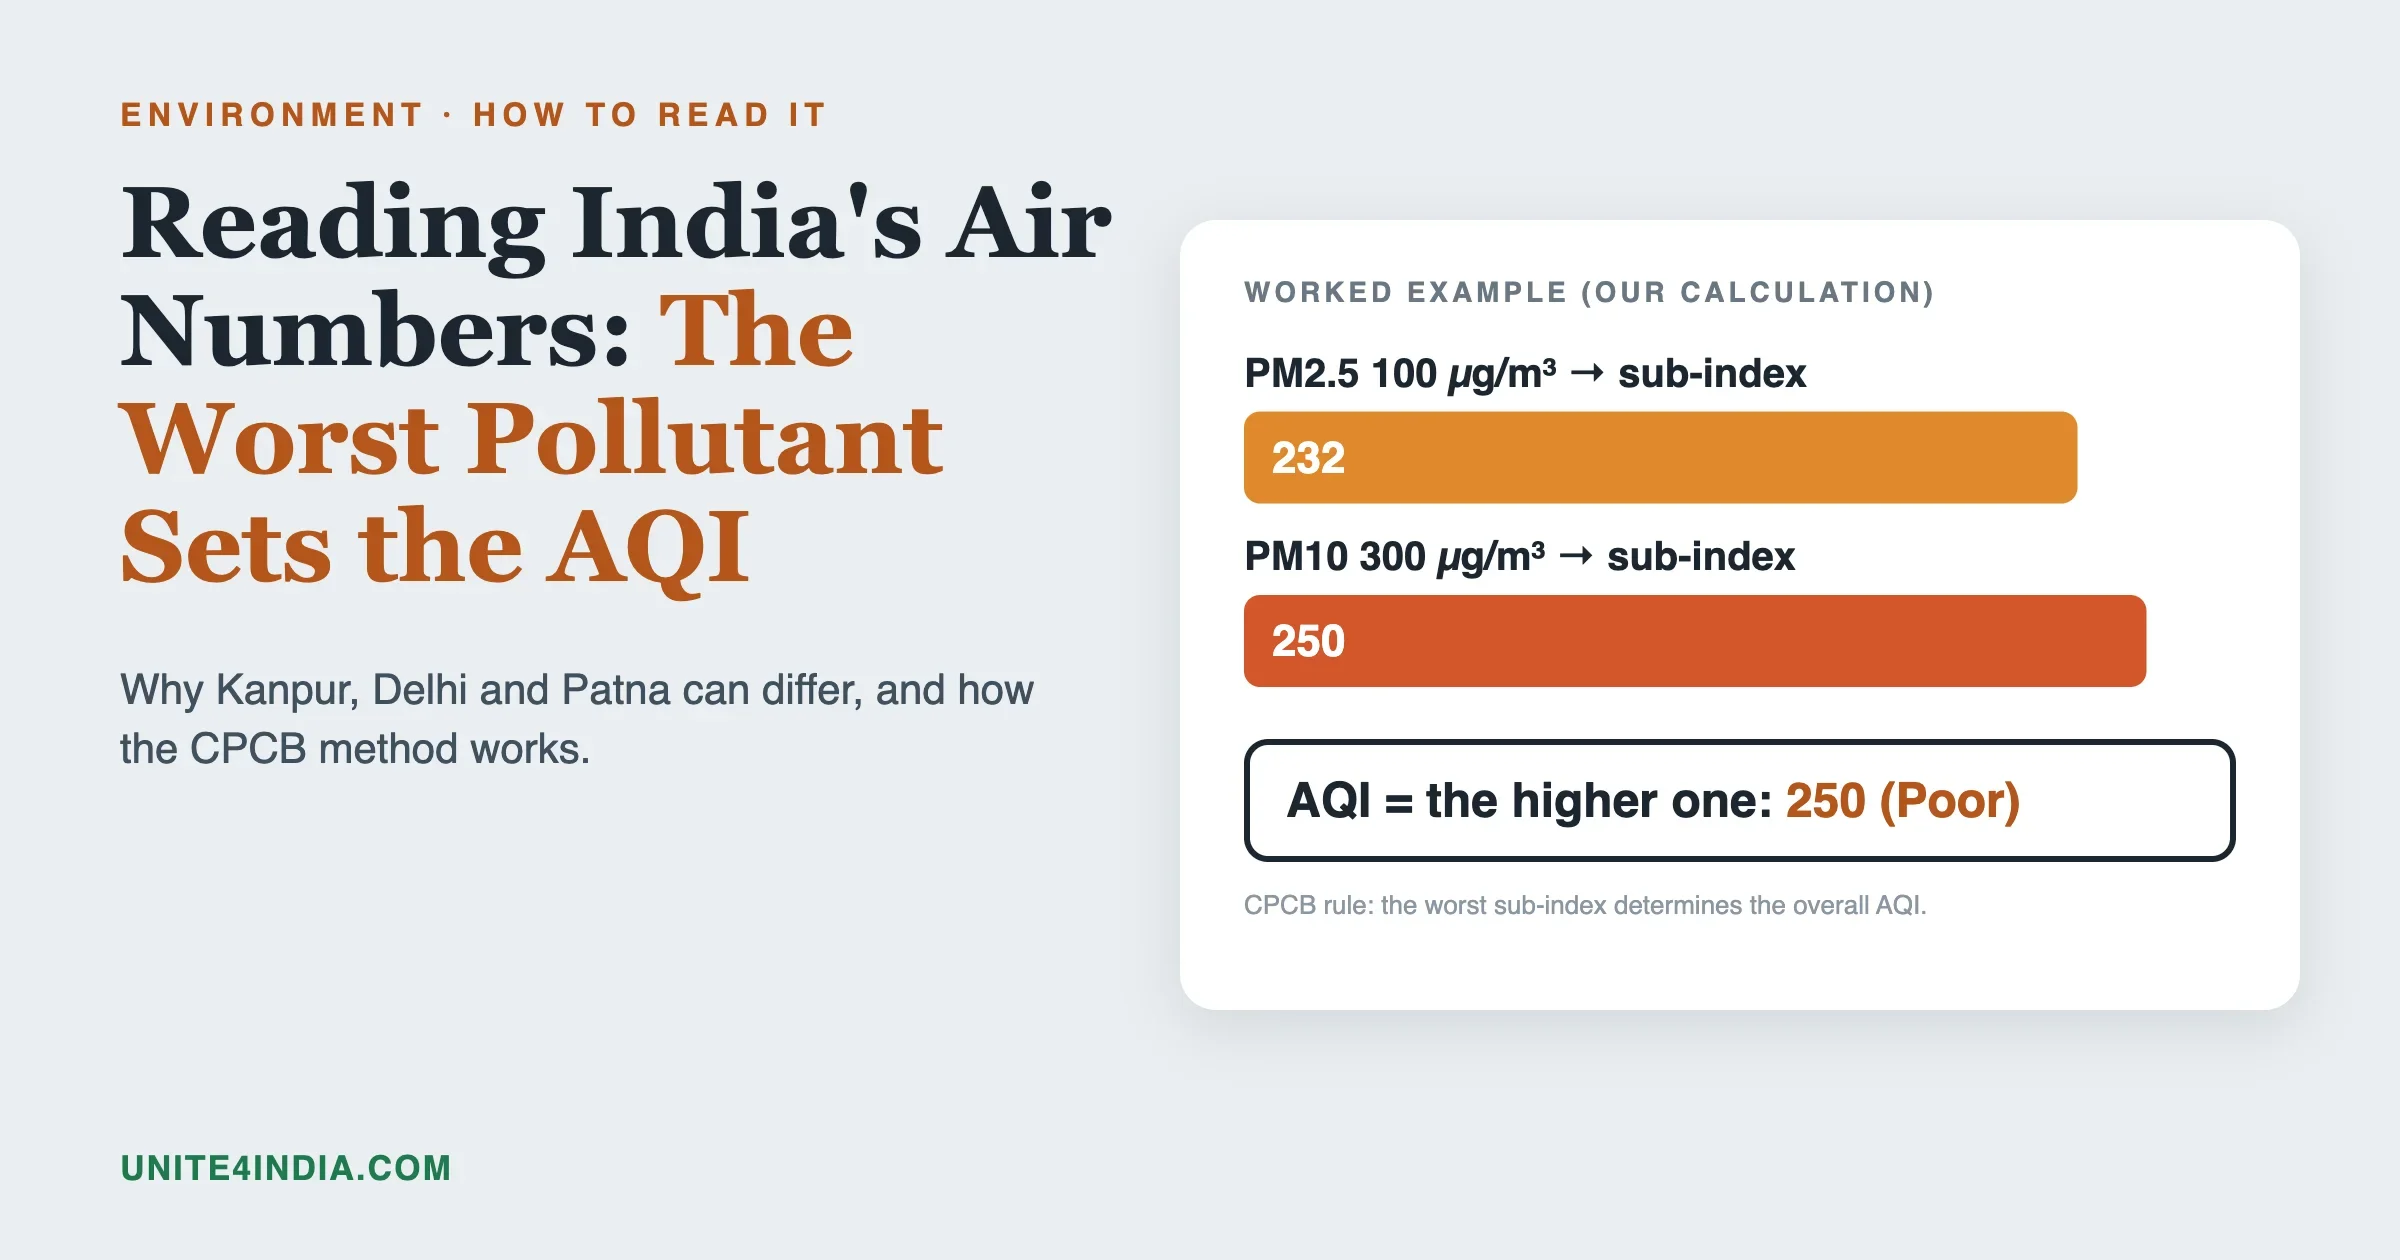
Suppose a station records a 24-hour PM2.5 of 100 µg/m³ and a 24-hour PM10 of 300 µg/m³.
- PM2.5 sub-index: 100 falls in the Poor band (91 to 120 µg/m³, AQI 201 to 300). Working it out in proportion: 201 plus (100 minus 91) divided by (120 minus 91) times 99 gives about 232.
- PM10 sub-index: 300 falls in the Poor band (251 to 350 µg/m³, AQI 201 to 300). The same method gives 201 plus (300 minus 251) divided by (350 minus 251) times 99, which is 250.
- Overall AQI: the larger of the two, 250. The prominent pollutant is PM10.
The PM2.5 reading alone would give 232, so the dust-heavy PM10 sets the number. This is why two cities with the same headline AQI can have very different air. One may have a smoke and vehicle problem, the other a dust problem.
A second worked example: a clean day
Take a station with a 24-hour PM2.5 of 25 µg/m³ and PM10 of 70 µg/m³. These are again our own calculations, using the CPCB breakpoints.
- PM2.5: 25 sits in the Good band (0 to 30 µg/m³, AQI 0 to 50). In proportion, 25 divided by 30 times 50 gives about 42.
- PM10: 70 sits in the Satisfactory band (51 to 100 µg/m³, AQI 51 to 100). For PM10, the sub-index in this range is the same number as the concentration, so it is 70.
- Overall AQI: 70, Satisfactory, driven by PM10.
Notice that the air is “Good” for PM2.5 and “Satisfactory” for PM10. The headline takes the worse one. If you care mainly about fine particles, look at the PM2.5 sub-index the CPCB dashboard shows next to the AQI. The CPCB says it publishes the individual pollutant sub-indices even when there are not enough data to calculate an overall AQI.
What each band means for health
The CPCB’s own report gives a health statement for each band.
Category | Associated health impact, per CPCB |
|---|---|
Good (0 to 50) | Minimal impact |
Satisfactory (51 to 100) | May cause minor breathing discomfort to sensitive people |
Moderate (101 to 200) | May cause breathing discomfort to people with lung disease such as asthma, and discomfort to people with heart disease, children and older adults |
Poor (201 to 300) | May cause breathing discomfort to people on prolonged exposure, and discomfort to people with heart disease with short exposure |
Very Poor (301 to 400) | May cause respiratory illness on prolonged exposure. Effects may be more pronounced in people with lung and heart disease |
Severe (401 to 500) | May cause respiratory effects even on healthy people, and serious health impacts on people with lung or heart disease. Impacts may be felt even during light physical activity |
The CPCB’s public guidance for Very Poor and Severe days is to minimise travel, avoid private vehicles, use public transport, bikes or walking, and carpool. It also lists vehicle upkeep, lane discipline, avoiding long idling and turning engines off at red lights.
Why the CPCB scale starts higher than the WHO guideline
The CPCB’s own report explains the PM2.5 breakpoints. It notes that the background level of PM2.5 in India has been estimated at 17 to 28 µg/m³, while in Europe and the United States it is below 5 µg/m³. Because of that, the CPCB set the first two categories, Good and Satisfactory, at 30 and 60 µg/m³ for PM2.5 and did not copy the American or European breakpoints for the lower range.
The World Health Organization’s 2021 guideline for PM2.5 is 5 µg/m³ for a year and 15 µg/m³ for 24 hours. India’s National Ambient Air Quality Standards of 2009 are 40 µg/m³ for a year and 60 µg/m³ for 24 hours. So a day of “Satisfactory” AQI in India can still be several times above the WHO guideline. This is a difference in design, not an error.
Air pollution levels in India: the numbers for 2025
For annual levels, the Centre for Research on Energy and Clean Air (CREA) has worked through CPCB data for the calendar year 2025 in its January 2026 report. Here is what it found for the country:
- Of 229 cities with at least 80 percent PM10 data, 190 were above the PM10 standard of 60 µg/m³ and 39 met it.
- Of 231 cities with at least 80 percent PM2.5 data, 103 were above the PM2.5 standard of 40 µg/m³ and 128 met it.
- The most polluted city for PM10 was Delhi at 197 µg/m³, followed by Ghaziabad at 190 and Greater Noida at 188.
- The most polluted for PM2.5 were Byrnihat in Assam at 100 µg/m³, Delhi at 96 and Ghaziabad at 93.
- The cleanest city for both was Tirunelveli in Tamil Nadu, at 28 µg/m³ for PM10 and 15 µg/m³ for PM2.5.
The report counts 1,600 monitoring stations in 2025: 565 continuous stations and 1,035 manual stations, covering 584 cities.
Delhi in 2025, day by day
CREA also counted days by AQI category for Delhi. Using PM10, Delhi had 8 days in Good, 73 in Satisfactory, 173 in Moderate, 69 in Poor, 36 in Very Poor and 6 in Severe. That adds up to 365 days. Delhi went above the daily PM10 standard on 284 days.
Using PM2.5, Delhi exceeded the daily standard on 212 of 365 days, with 86 Very Poor days and 18 Severe days. So the same city, in the same year, looks different depending on which pollutant you count. PM10 shows more days in the Moderate band, and PM2.5 shows more days in the worst bands.
Why Kanpur, Delhi and Patna differ
People ask why “air pollution level in Kanpur” looks different from Delhi or Patna. We checked the CREA report and found Delhi’s 2025 figures, but not city-level 2025 figures for Kanpur or Patna in a form we could confirm. So we do not give numbers for those two. What we can do is explain the reasons the numbers differ, and show you how to check them yourself.
1. They sit in the same region, but not the same airshed
All three are in or near the Indo-Gangetic Plain, where CREA found 47 of 61 cities with enough PM2.5 data above the national standard. Bihar had 20 of 24 monitored cities above it, and Uttar Pradesh had 13 of 20. Cold, calm winter air and a basin-like setting trap pollution across the plain. But local sources vary. Delhi sits in the National Capital Region, where 12 of 14 cities with data were above the PM2.5 standard.
2. They may be measured at different stations
A city’s reading comes from its monitors. CREA notes that data quality is a concern in India because of maintenance problems and because some stations do not follow the CPCB’s siting guidelines. A station beside a main road reads higher than one in a park. If one city has five stations and another has one, the “city average” is built from different sets of places.
3. They may measure different pollutants
Only cities where stations report enough PM2.5 or PM10 data get an overall AQI. Some stations report PM10 but not PM2.5. The CPCB says all eight pollutants may not be monitored at all locations, so two cities can be compared on different pollutant sets without anyone noticing.
4. The mix of sources is different
Dust, vehicles, industry, biomass burning, waste burning and household fuel each contribute differently in different places. Source apportionment studies are meant to answer this. CREA’s report lists Kanpur, Delhi and Patna among the cities that have completed a source apportionment study, so a study exists for each. We have not read the results for Kanpur and Patna, so we do not state shares. They are published through the national PRANA portal, which CREA cites as its source for this list.
5. They have different days of data
The CPCB needs at least 16 hours of data per day for a sub-index, and CREA uses a threshold of 80 percent of days with data for its city rankings. A city with a long outage can drop out of a ranking or show a lower average. That is a data gap, not clean air.
6. Different reports use different years and sources
For Delhi in 2025, three numbers circulate for PM2.5. CREA, using CPCB data, gives 96 µg/m³. IQAir’s 2025 report, as reported in the press, gives 82.2 µg/m³ for New Delhi city and 99.6 µg/m³ for the wider Delhi territory. IQAir uses a mix of regulatory and other sensors, and it separates city and territory. The numbers differ because the question being asked is different. When you compare Kanpur, Delhi and Patna, make sure you use one source, one pollutant, one year and one area.
How to compare any two Indian cities yourself
- Open the CPCB air quality dashboard at airquality.cpcb.gov.in and choose each city.
- Look at the prominent pollutant for each station. A PM10-driven city and a PM2.5-driven city are different problems.
- Note the number of stations and the time of the last update.
- Compare the same days. Use the same date range, ideally a full season or year.
- Compare the same pollutant. Use PM2.5 for health comparisons, and PM10 if you want to see dust.
- Check data coverage. If one city has many missing days, treat its average with care.
How to use air pollution levels in India in daily life
These steps use the CPCB’s own health statements and public guidance. They are not medical advice, and anyone with heart or lung disease should follow their doctor’s plan.
AQI band | Sensible habits |
|---|---|
Good and Satisfactory | Normal routine. People who are sensitive may notice mild breathing discomfort on Satisfactory days. |
Moderate | People with asthma or heart disease, children and older adults should watch for discomfort and keep medicines to hand. |
Poor | Cut long outdoor exercise. People with heart disease may feel discomfort even in a short exposure. |
Very Poor | Limit time outdoors. The CPCB advises minimising travel, using public transport or carpooling instead of private vehicles, and avoiding larger vehicles. |
Severe | Stay indoors where you can. Even healthy people may have respiratory effects, and effects can appear during light activity. |
Timing matters as well. The real-time AQI is a running 24-hour average, so a bad night can still show in the next morning’s number even after the air starts to clear.
Annual averages and daily AQI answer different questions
A city’s annual average tells you the long-term load. A daily AQI tells you what today is like. The two can disagree. Delhi’s 2025 annual PM10 of 197 µg/m³ is about three times the national standard, and yet CREA’s day count shows 8 Good and 73 Satisfactory PM10 days in the same year. A city can have a poor year overall and still have some clean days, and a city with a “Satisfactory” annual average can still have a bad week.
When you read a headline, ask which of these it is. “Delhi is the most polluted city” is an annual claim, and “AQI hits 400 today” is a daily one. Each is true in its own terms and neither tells the whole story.
Real-time AQI versus the official record
The CPCB is open about the limits of its live numbers. It says real-time AQI is fed directly from analysers without scrutiny, so it may not be for statutory purposes. It also says monitoring stations can be affected by long power cuts and maintenance problems, and data flow can be disrupted for a time. So use live AQI as a warning, and use checked data for reports, comparisons and studies.
Apps that show an AQI may use a different method from the CPCB. Some use the US method, which has stricter breakpoints in the lower range. A US-style number can look worse than the CPCB number for the same air, so check which scale an app uses.
Three things the AQI does not tell you
- It does not show a whole year. One day’s number is a snapshot. Annual averages, such as the CREA figures, show the long-term load.
- It does not show indoor air. Cooking smoke and other household sources are outside the AQI of an outdoor station.
- It does not show your street. A station may be a few kilometres away, and air near traffic or a factory can be worse.
Where to read more
For the full picture of causes, health estimates and what you can do, read our refreshed guide to air pollution in India. For how cities in the National Clean Air Programme have tracked over time, see the city scorecard. For how pollution reaches water as well, see our piece on the Yamuna in Delhi.
Common questions
What AQI is safe in India?
The CPCB calls 0 to 50 Good, with minimal impact, and 51 to 100 Satisfactory, with minor breathing discomfort to sensitive people. Above 100, people with lung or heart disease, children and older adults may feel discomfort.
Why is AQI different on different apps?
Apps may use a different station, a different time window or a different scale. The CPCB’s number is based on the worst sub-index of up to eight pollutants. Some apps use the US method.
Which pollutant sets the AQI?
The one with the highest sub-index at that station. In most Indian cities in winter, that is PM2.5 or PM10.
What is the AQI at 500?
500 is the top of the CPCB scale. The Severe band is 401 to 500.
Is Kanpur more polluted than Delhi?
We did not find a confirmed 2025 annual figure for Kanpur to compare. Delhi’s 2025 annual PM2.5 and PM10, from CREA’s analysis of CPCB data, were 96 and 197 µg/m³. For Kanpur, use the CPCB dashboard for the same period.
How do I find the air pollution levels in India for my city today?
Use the CPCB dashboard or the CPCB’s official mobile app and choose the station nearest to you.
Does a high AQI always mean smoke?
No. A high AQI can come from dust, vehicle exhaust, industry, burning of waste or crop residue, or a mix. The pollutant that sets the number, shown on the dashboard as the prominent pollutant, gives the first clue. A PM10-led day points to dust, and a PM2.5-led day points to combustion and secondary particles formed from gases.
What we could not confirm
We did not find confirmed 2025 annual averages for Kanpur or Patna, so we describe how to compare them and do not give numbers. We did not read the source apportionment results for any city. The CPCB’s live dashboard could not be read by our tools, so we used its method documents instead. The IQAir figures come from press coverage of its 2025 report, and we did not open the full report. The worked example is our own calculation, using the CPCB breakpoints, and it is not a measurement.
Sources
- CPCB, National Air Quality Index: About AQI, How AQI is Calculated, Guidelines, Limitations and the AQI report.
- CREA, Tracing the Hazy Air 2026 (January 2026), calendar-year 2025 data from CPCB monitors.
- IQAir, 2025 World Air Quality Report (March 2026), as reported in the press.
- WHO Global Air Quality Guidelines (2021).
Checked on 11 November 2026.
What you can do
- Share the evidenceSend this to one person who should know about environment.Share on WhatsApp
- Give an afternoonTeach, mentor, clean up, or lend your professional skills.Ways to volunteer
- Tell us what's missingKnow a story, a fact we got wrong, or a solution worth spotlighting?Suggest a story
Politically neutral. Every claim sourced. Report a correction.


No comments yet