India's Clean Air Programme Scorecard: Which Cities Cut Pollution and Which Did Not
Seven years into the National Clean Air Programme, 21 cities cut PM10 by over 40 percent, 23 got worse, and 117 of 130 still breach the limit. A city-by-city read of the data.
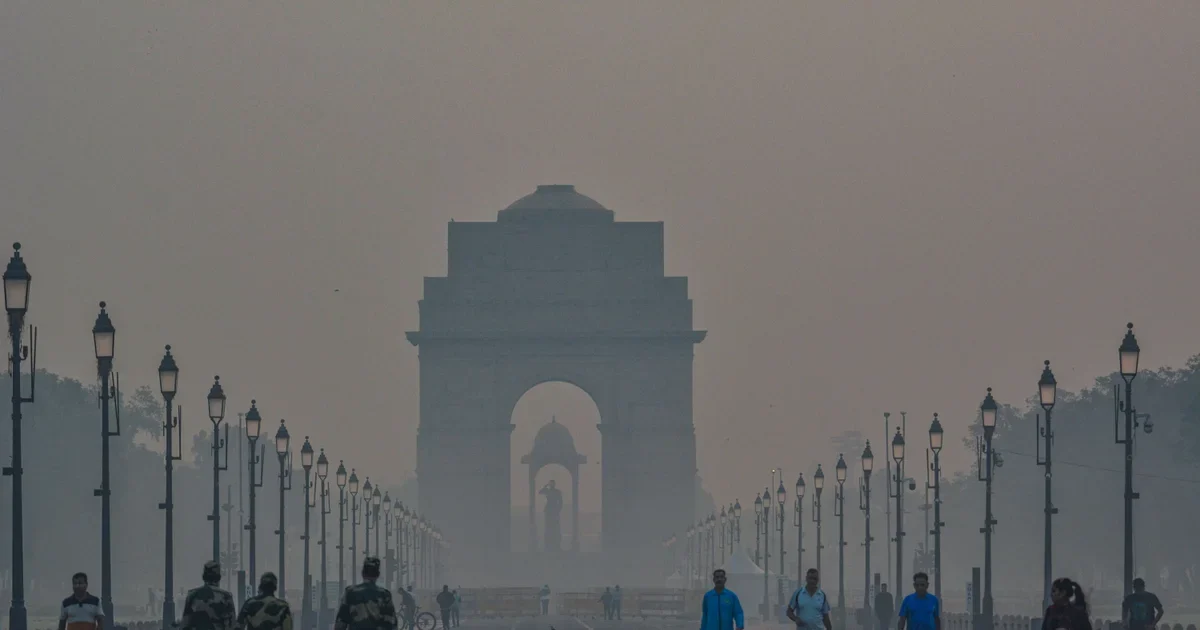
Photo by Saakshi Yadav on Pexels
In this story
The National Clean Air Programme (NCAP) has now run long enough to be judged on results. The short version: some cities have cleaned their air by a large margin, many have improved a little, a minority have got worse, and most still breathe air above the national limit for coarse particles. Of the 130 cities tracked, the Centre for Research on Energy and Clean Air (CREA) found that only 21 had cut PM10 by more than 40 percent against 2017-18, 23 were dirtier than in 2017-18, and 117 still exceeded the annual PM10 limit of 60 micrograms per cubic metre in 2025-26.
Our earlier post, Air Pollution in India: Beyond Delhi’s Headlines, covered the causes, the health toll and the full menu of solutions. This post does something narrower. It reads the programme’s own scorecard, city by city, and asks which results hold up, which are artefacts of how the numbers are counted, and what the better cities seem to have done.
What was the National Clean Air Programme meant to achieve?
NCAP was launched in 2019 to cut particulate pollution in the cities that were failing national air quality standards for several years running, called non-attainment cities. The official count is 131 cities and urban agglomerations. Some analyses count 130 because two towns, Asansol and Raniganj, are treated as one unit.
The original goal was a 20 to 30 percent reduction in particulate matter by 2024, measured against a 2017 base year. As Business Standard reported from CPCB data, the target was later revised to a 40 percent reduction by 2026, using 2019-20 as the base year. The same report notes that in practice only PM10, the coarser particles, is used to judge a city’s performance. PM2.5, the fine particles that go deepest into the lungs, is not the yardstick, even though it is the one most tied to deaths.
Money followed. According to CREA’s reading of the government’s PRANA portal, about Rs 16,824 crore had been released to the cities and Rs 12,087 crore, or about 72 percent, had been spent. The government’s own figure is slightly lower: Rs 16,423.56 crore released and Rs 11,575.54 crore used, or 70.5 percent. Both are reported by ETV Bharat, in its coverage of the CREA analysis published on 26 October 2026.
What do the results say overall?
It depends on which year you compare with which, and that is the first lesson. Three baselines are in play: 2017-18 (the original), 2019-20 (the programme start, now the official base for the 2026 target) and 2025-26 (the end of the extended period).
The government view, September 2024
CPCB data reported in September 2024 said that 95 of the 131 cities had improved their PM10 against 2017-18, and 21 had cut it by more than 40 percent. Only 18 cities met the 60 microgram standard. The bands were as follows.
PM10 fall since 2017-18 | Cities | Examples named by CPCB |
|---|---|---|
More than 40 percent | 21 | Varanasi, Dhanbad, Byrnihat, Bareilly, Firozabad, Dehradun, Moradabad, Lucknow, Kanpur, Agra, Greater Mumbai |
30 to 40 percent | 14 | Ahmedabad, Ghaziabad, Kolkata, Amritsar, Jodhpur |
20 to 30 percent | 16 | Surat, Bengaluru, Hyderabad, Noida, Gorakhpur, Ranchi |
10 to 20 percent | 21 | Delhi, Jaipur, Nashik, Thane, Kota, Jhansi |
The CREA view, October 2026
CREA’s newer analysis extends to 2025-26 and tells a harder story. Against 2017-18, 21 cities cut PM10 by more than 40 percent, 23 cities were worse and 2 were unchanged. Against the more recent 2019-20 base, only 8 cities cut it by more than 40 percent, and 43 cities were worse, with 3 unchanged. In 2025-26, 117 of 130 cities were above the 60 microgram limit, compared with 125 in 2017-18 and 112 in 2019-20. Only 13 met the standard. The government’s own count for the same year is somewhat kinder: 26 cities with a cut of more than 40 percent and 14 meeting the standard, according to the ETV Bharat report.
PM10 change | Cities vs 2017-18 | Cities vs 2019-20 |
|---|---|---|
0 to 10 percent lower | 17 | 15 |
10 to 20 percent lower | 22 | 22 |
20 to 30 percent lower | 22 | 22 |
30 to 40 percent lower | 23 | 17 |
More than 40 percent lower | 21 | 8 |
The table is drawn from the analysis by Manoj Kumar of CREA, using CPCB data. Read it this way: the programme has moved most cities in the right direction, but the improvement is mostly modest, and the more recent your starting point, the less impressive the record looks.
Which cities improved the most?
Varanasi appears at the top of almost every list. In a five-year study by Climate Trends and Respirer Living Sciences, reported by Down To Earth, Varanasi cut PM10 by about 63 percent between 2019 and 2023 and PM2.5 by about 72 percent. Talcher in Odisha was next on PM10, and Agra, at 53 percent, was second on PM2.5. CPCB’s 2017-18 comparison also places Varanasi in the top band.
The CPCB top band reads like a map of the northern plains and the hill towns: Varanasi, Bareilly, Moradabad, Firozabad, Lucknow, Kanpur, Agra and Khurja in Uttar Pradesh; Dehradun and Rishikesh in Uttarakhand; Nalagarh, Parwanoo and Sunder Nagar in Himachal Pradesh; Dhanbad in Jharkhand; Tuticorin and Trichy in Tamil Nadu; Kadapa in Andhra Pradesh; Kohima in Nagaland; Sivasagar in Assam; Byrnihat on the Assam-Meghalaya border; and Greater Mumbai. Byrnihat shows how a good percentage can still be a poor absolute level: CREA reports it fell from 175 to 105 micrograms per cubic metre, about 40 percent, and that is still well above the 60 standard.
Surat holds a special place. CPCB places it in the 20 to 30 percent band against 2017-18, and it was named the top major city for air quality improvement in the 2024 Swachh Vayu Survekshan, followed by Jabalpur and Agra. Surat also hosts the world’s first market for trading particulate emissions, discussed below.
Which cities got worse?
CREA names the largest increases in PM10 and the amount each city had used from NCAP funds.
City | PM10 change | Baseline | NCAP funds used |
|---|---|---|---|
Visakhapatnam | Up 67.1 percent | 2017-18 | Rs 74 crore |
Navi Mumbai | Up 59.3 percent | 2019-20 | Rs 80 crore |
Nashik | Up 40.4 percent | 2019-20 | Rs 88 crore |
Meerut | Up 31.1 percent | 2017-18 | Rs 191 crore |
Pune | Up 24.7 percent | not stated | Rs 289 crore |
Jaipur | Up 14.5 percent | 2019-20 | Rs 353 crore |
Chennai | Up 9.1 percent (20 percent vs 2019-20) | 2017-18 | Rs 449 crore |
Bengaluru | Up 6.8 percent | not stated | Rs 313 crore |
The earlier five-year study found Durgapur in West Bengal had the biggest PM10 rise over 2019 to 2023, from 77.2 to 118.2 micrograms per cubic metre, a jump of more than 53 percent, followed by Thane, Mumbai, Navi Mumbai, Aurangabad and Asansol. Navi Mumbai also had the largest PM2.5 rise, about 47 percent, close to Ujjain.
Some of these cities are large spenders. Chennai, Bengaluru, Jaipur and Pune each used Rs 289 to 449 crore and still show a rise on at least one baseline. This does not prove the money was wasted. Construction booms, traffic growth and weather all push particle levels up. It does show that spending alone does not guarantee results, a point we return to below.
What is happening in Delhi?
Delhi is the most-watched city, and the official series is public. The Ministry of Environment, Forest and Climate Change released the annual averages of daily readings in a PIB release dated 2 January 2026.
Year | PM10 (micrograms per cubic metre) | PM2.5 (micrograms per cubic metre) |
|---|---|---|
2018 | 242 | 114 |
2019 | 218 | 109 |
2020 (Covid year) | 181 | 95 |
2021 | 211 | 105 |
2022 | 211 | 98 |
2023 | 206 | 100 |
2024 | 212 | 105 |
2025 | 198 | 97 |
Delhi’s 2025 average is the lowest on the series apart from the Covid lockdown year. PM10 is down about 18 percent from 2018 and PM2.5 about 15 percent. That is real movement, and it is the same 10 to 20 percent band CPCB placed Delhi in for the NCAP comparison. It is also nowhere near safe. The national annual standard is 60 for PM10 and 40 for PM2.5, so Delhi’s 198 and 97 are about 3.3 and 2.4 times the limits. The World Health Organization’s 2021 guideline for PM2.5 is 5.
The series also shows how slowly things move. Between 2021 and 2024 the PM10 average barely changed (211, 211, 206, 212). The 2025 dip came after several years of flat readings. A single better year is not yet a trend.
Why did some cities improve?
The data cannot tell us. CREA’s analysis states plainly that it does not establish that the spending caused the changes, and the sources behind Varanasi’s fall do not attribute it to a specific measure. What we can do is set out the candidate explanations and what is known about each.
Controlling road and construction dust
Road dust is the cheapest big target for PM10, and cities have put most of the money there. CREA analyst Manoj Kumar told ETV Bharat that about 68 percent of NCAP funds went to dust mitigation, and another expert quoted by Down To Earth put the road dust share at about 64 percent. Source studies cited by the environment ministry attribute 14 to 58 percent of PM10 to road dust and construction, depending on the city. Mechanical sweepers, water sprinkling, paved road shoulders and green belts are the typical tools.
This approach works on PM10, the measured target, but touches PM2.5 much less. A city can meet the PM10 yardstick through dust control while its fine-particle problem from vehicles, industry and burning stays largely unaddressed. That is part of why Delhi’s PM2.5 barely moves while its PM10 falls.
Pricing industrial pollution in Surat
In 2019 Gujarat launched the world’s first market for particulate emissions in Surat. Industrial plants receive a cap and can trade permits, so the cheapest cuts happen first. A randomised study of 317 coal-burning plants, published in the Quarterly Journal of Economics and summarised by the Energy Policy Institute at the University of Chicago, found plants in the market cut emissions by 20 to 30 percent and cut compliance costs by around 11 percent compared with plants under traditional rules. The market was extended to other industrial areas in Gujarat in 2023.
The result applies to the participating factories, not to the city’s overall PM10. Surat’s 20 to 30 percent fall in CPCB’s comparison is consistent with it but is not proof of it, because Surat also invested in road dust control. Still, it is the best-evidenced air policy idea in the country, because it tested the policy against a comparison group.
Waste, transport and fuel switching
Our post on Indore shows how a city that handles its waste properly removes a major source of open burning, and Delhi’s shift to CNG for buses and autos remains one of the better-documented fuel switches. The earlier clean-air post sets out how cities like Indore and states like Punjab have approached waste and stubble. None of these has yet been tied, in a controlled study, to city-wide PM10 numbers in the NCAP dataset.
Can we trust the numbers?
Partly. The ranking is useful, but five limits matter.
- Baselines move the answer. The same city can be a success against 2017-18 and a failure against 2019-20. Greater Mumbai is in CPCB’s top band against 2017-18, with a fall of more than 40 percent, while the Climate Trends study found Mumbai’s PM10 rose about 37 percent between 2019 and 2023. Both can be true if 2017-18 was a high year.
- Only PM10 counts. A city can pass the test while its fine-particle level worsens.
- Few monitors. Many cities have only one or a handful of stations, so one site’s move can swing the city number.
- Weather. Rainfall, wind and temperature change yearly averages by large margins. A wet year looks like policy success.
- City boundaries. The Centre for Science and Environment’s review of NCAP argues that plans which draw a hard line around a city cannot reach sources outside it, such as crop burning, brick kilns and power plants in the wider region.
The broader picture is also bigger than NCAP. CREA’s separate assessment, as quoted by ETV Bharat, found that 1,787 of 4,041 cities exceeded the annual PM2.5 standard in each of five selected years between 2019 and 2024, and only 67 of them were NCAP cities. Most Indian towns have no programme at all.
Did more money mean cleaner air?
Partly, but not reliably. CREA published the amount used by each group of cities, and the groups differ in size, so the fair comparison is the average per city. These averages are our own division of CREA’s published totals by the number of cities in each band.
Group (change in PM10) | Cities | Funds used | Average per city |
|---|---|---|---|
More than 40 percent lower vs 2017-18 | 21 | Rs 3,023 crore | about Rs 144 crore |
30 to 40 percent lower vs 2017-18 | 23 | Rs 3,679 crore | about Rs 160 crore |
0 to 10 percent lower vs 2017-18 | 17 | Rs 1,319 crore | about Rs 78 crore |
Higher vs 2017-18 | 23 | Rs 961 crore | about Rs 42 crore |
More than 40 percent lower vs 2019-20 | 8 | Rs 1,586 crore | about Rs 198 crore |
Higher vs 2019-20 | 43 | Rs 2,857 crore | about Rs 66 crore |
On average, the cities that improved most used more money per city, and the cities that got worse used less. That fits the idea that a city that cannot spend its funds cannot clean its air. It is not proof of cause, since CREA itself says its analysis does not establish that spending caused the changes. And the exceptions are large: Chennai, Bengaluru, Jaipur and Pune spent heavily and still saw a rise. Money looks necessary but not sufficient. What it buys, and whether the city also deals with its largest sources, decides the result.
What would make the programme work better?
The evidence points to a few changes that are practical, not exotic.
- Judge cities on PM2.5 as well as PM10. PM2.5 is the pollutant behind most air-pollution deaths, and a programme measured only on PM10 will keep spending on dust.
- Plan by airshed, not city. Pollution crosses municipal borders. Clean air plans should cover the region that actually feeds the city’s air, as CSE has urged.
- Link funds to outcomes. The spending data show that money flowed to cities whether or not their air improved. Releasing a share of the funds against verified cuts would sharpen incentives.
- Test before scaling. Surat’s market was run as a trial with a comparison group, which is why we know it worked. The same discipline would show which dust-control methods actually lower the monitored numbers.
- Publish raw data. CPCB’s portal already carries city data. A plain annual scorecard for each city, with baseline year, monitors and uptime, would let citizens check the claims in this post themselves.
What can you do?
- Look up your own city. Check whether it is on the NCAP list, then read its city action plan, usually posted on the municipal corporation or state pollution control board site.
- Ask for the monitor data. Use the Right to Information Act to ask how many monitors your city has, how many days each worked last year, and how the NCAP money was spent.
- Attend ward committee meetings. Dust control, waste burning and construction rules are enforced by the municipality. Complaints about open burning and uncovered construction sites are the most direct action a resident can take.
- Cut your own exposure on bad days. Check the AQI before outdoor exercise, keep windows closed in the worst hours and use a well-fitted N95 mask when readings are high. Our post on outdoor workers in heatwaves shows how exposure falls hardest on people who cannot stay indoors.
- Do not burn waste. Leaves, plastic and household trash are a daily source in most colonies. See what the rules say in our post on plastic waste in India.
- Support clean transport. Buses, cycling lanes and walkable streets cut the vehicle share of the problem for everyone.
Frequently asked questions
What is the National Clean Air Programme?
It is a national programme launched in 2019 to reduce particulate pollution in 131 cities that fail national air quality standards. It funds city plans, monitoring and mostly dust control.
Which city has improved most under NCAP?
Varanasi is the most-cited leader. A five-year study reported a PM10 fall of about 63 percent from 2019 to 2023, and CPCB places it in the top band against 2017-18. The causes have not been separated out.
How many cities have met the target?
It depends on the measure. Against 2017-18, 21 cities cut PM10 by more than 40 percent in CREA’s count. Against 2019-20, the official base for the 2026 target, only 8 did. Only 13 cities, according to CREA, met the 60 microgram annual standard in 2025-26.
Has Delhi’s air improved?
A little. Annual PM10 fell from 242 in 2018 to 198 in 2025, and PM2.5 from 114 to 97, the lowest in the series apart from 2020. Both remain far above national standards.
Why does the government count differ from CREA’s?
The two use different years, different data cleaning and different rules for incomplete monitors. The ETV Bharat report records the government’s count as 26 cities with a cut of more than 40 percent against CREA’s 21.
The takeaway
NCAP shows that cleaner air is achievable in Indian cities, because some have done it, and that effort does not guarantee it, because some that spent heavily got worse. The programme’s weakest design choice is its yardstick: PM10 alone, one baseline that keeps changing, and a city boundary that pollution ignores. If the next phase measures fine particles, plans by airshed and tests its methods, the next scorecard will say a lot more about what works.
Sources: Central Pollution Control Board data as reported by Business Standard (September 2024); Centre for Research on Energy and Clean Air analysis as reported by ETV Bharat and by Manoj Kumar (October 2026); Ministry of Environment, Forest and Climate Change via Press Information Bureau (2 January 2026); Climate Trends and Respirer Living Sciences study via Down To Earth; Energy Policy Institute at the University of Chicago; Centre for Science and Environment.
What you can do
- Share the evidenceSend this to one person who should know about environment.Share on WhatsApp
- Give an afternoonTeach, mentor, clean up, or lend your professional skills.Ways to volunteer
- Tell us what's missingKnow a story, a fact we got wrong, or a solution worth spotlighting?Suggest a story
Politically neutral. Every claim sourced. Report a correction.

No comments yet