What One Government School Seat Actually Costs
Households spend Rs 2,863 a year on a child in a government school and Rs 25,002 in a non-government one. The state spends far more, and the gap between states is sixfold. What a school seat costs and what it buys.
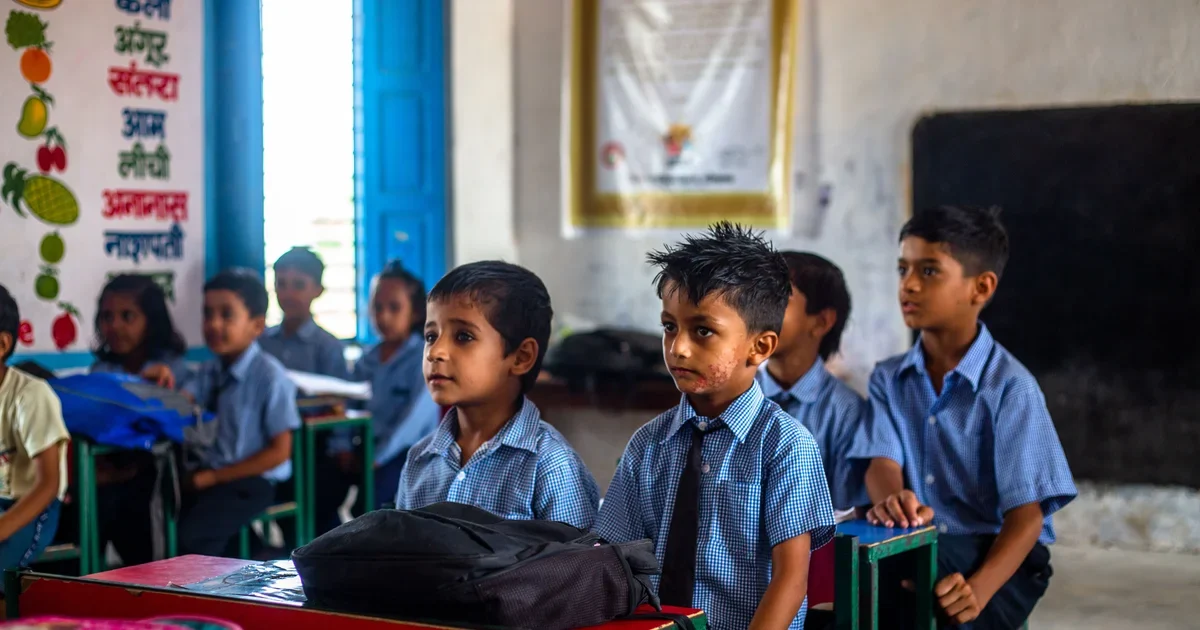
Photo by Swastik Arora on Pexels
In this story
Rs 2,863 against Rs 25,002. Those are the average amounts that Indian households spent on one child’s school education in a year, according to the Comprehensive Modular Survey on Education 2025, one for a child in a government school and one for a child in a non-government school. The first number is about an eighth of the second. It is the figure that explains why so many parents who can find the money leave the public system, and why 55.9 percent of India’s students still stay in it.
But Rs 2,863 is not what a government school seat costs. It is only what the family pays. The rest is paid by the state, out of taxes, and that bill is large, uneven and rarely printed on any receipt. This piece adds up both sides. What does the family pay? What does the state pay? Where does the state’s money go? And does paying more buy better learning? We look at Kerala, Himachal Pradesh and Delhi along the way. For what families pay to get past the school gate into a rank list, see our separate piece on the coaching bill. This one stays inside the classroom.
What does a family pay for a government school child?
The answer from the latest national survey is: not much, but not nothing. The CMS Education survey, part of the 80th round of the National Sample Survey, covered 57,742 students in 52,085 households between April and June 2025. It found that households spent an average of Rs 2,863 per student in government schools during the academic year, against Rs 25,002 in non-government schools, as the PIB release on the survey reports.
Indicator | Value | Source/Year |
|---|---|---|
Students in government schools | 55.9% (66.0% rural, 30.1% urban) | CMS Education 2025 |
Students in private unaided recognised schools | 31.9% | CMS Education 2025 |
Household spend per student, government schools | Rs 2,863 a year | CMS Education 2025 |
Household spend per student, non-government schools | Rs 25,002 a year | CMS Education 2025 |
Students paying course fees, government schools | 26.7% | CMS Education 2025 |
Students paying course fees, non-government schools | 95.7% | CMS Education 2025 |
Students taking private coaching | 27.0% | CMS Education 2025 |
Three details matter. First, course fees are the largest line. Across all school types the average was Rs 7,111 per student, with Rs 15,143 in urban areas and Rs 3,979 in rural areas. Second, textbooks and stationery came next at Rs 2,002. Third, about 95 percent of students said that other members of the household were their main source of funding, and only 1.2 percent named a government scholarship.
The survey cautions that its results cannot be set directly beside the earlier NSS 75th round for 2017-18. The older round counted private coaching inside school expenses, and it did not classify anganwadi centres as pre-primary. Treat any comparison across the two rounds as unsafe.
The number also hides who is not paying. Only 26.7 percent of government school students paid course fees at all, because the Right to Education Act makes elementary schooling free and many states also supply textbooks and uniforms. For those families the real costs are the unglamorous ones: transport, notebooks, shoes, a uniform that lasts one year, and the tuition teacher many parents hire when they doubt the classroom.
What does the state spend on one government school seat?
Here the answer depends heavily on the state, and national averages hide it. The Accountability Initiative at the Centre for Policy Research tracked per-student spending in government schools across eight states. Its 2017-18 numbers, as reported by IndiaSpend, ranged from Rs 9,573 in Bihar to Rs 59,499 in Himachal Pradesh. That is a gap of about six times. A child in a Himachal government school had roughly Rs 5,000 a month of public money behind her. A child in a Bihar government school had about Rs 800.
Two features of those numbers deserve a closer look. The first is enrolment. Bihar had 21.6 million students in government schools in 2017-18. Himachal Pradesh had 900,000. A small hill state with fewer children per school and a long record of investing in schools can spend a great deal on each child. A state with more than twenty times the students and a much lower tax base starts from a different place.
The second is the trend. Per-student spending rose in several states between 2014-15 and 2017-18, but the same study found that government school enrolment fell in all the states it analysed except Rajasthan. When enrolment falls and teacher salaries stay fixed, the spending per child rises even if nobody has added a classroom. A rising figure can therefore mean more money, fewer children, or both.
The central government adds a layer through Samagra Shiksha, the umbrella scheme covering pre-school to Class 12. The Centre allocated Rs 37,453 crore to it in 2023-24, according to the CPR Budget Brief. Spread across all government and aided students, the central money is small. For 2021-22, IndiaSpend, citing CPR’s analysis, reported an average allocation of Rs 3,967 per student, of which Rs 2,543 was actually spent. The scheme matters most in poorer states. In states such as Kerala and Maharashtra, it is a small part of total school spending, because the state’s own budget carries most of the load.
Where does the money go?
Mostly to teachers. In all eight states the Accountability Initiative studied, teacher salaries were the largest share of school expenditure. That is not a scandal. A school is made of teachers, and salaries are what it costs to keep one adult in front of each class. But it explains two things people often misread.
First, it explains why the same rupee goes further in some states than others. A state’s per-student figure therefore tracks its pay scales, its number of teachers per school and how many posts are vacant. When the number is low, it can mean lower average pay and more unfilled posts, not a leaner school.
Second, it explains why only a small share is left for everything else. After salaries, there is not much for libraries, labs, repairs, toilets and training. Our earlier piece on why the middle class abandoned government schools describes the vacancies that follow: it cites more than a million vacant teaching posts.
The second large item is the midday meal, now run as PM POSHAN. From December 2024 the Centre’s food-material rate was raised to Rs 6.19 per child per day for primary classes and Rs 9.29 for upper primary, up from Rs 5.45 and Rs 8.17, as GKToday reports. Cooking costs, cooks’ honoraria and fuel are paid separately, so the full cost of a meal is higher than these rates. Even so, the numbers are small, and they show how thin the margin is: a meal is a significant part of what many families get from the school, and a modest increase in food prices can undo a budget raised a year ago.
The national teacher count gives a sense of scale. UDISE+ 2023-24 recorded about 24.8 crore students in school, and one analysis of the data puts government school teachers at about 5.03 million. See the trends in UDISE+ key indicators for the series. Those teachers are the single largest public payroll in most states.
Does more money buy better learning?
Only partly, and the evidence is clear that the relationship is weak. The Accountability Initiative itself notes that it found no clear evidence that raising per-student spending, on its own, raises learning. That surprises people, but it follows from where the money goes. If most of it pays salaries, then outcomes depend on whether the teachers are present, trained, supported and held to account, not on the size of the cheque.
The learning gap shows up in the Annual Status of Education Report. In ASER 2024, about 44.8 percent of Class 5 children in government schools in rural India could read a Class 2 level text, up from 38.5 percent in 2022 and roughly level with 2018’s 44.2 percent. In private schools the figure was 59.3 percent, up from 56.8 percent in 2022 (see this summary of ASER 2024). A private school child is more likely to read at grade level, but the difference is a fraction of the difference in what families pay: household spend in non-government schools is nearly nine times higher, while the share of children reading at grade level is about a third higher.
Care is needed with that comparison. Private school children come from families that are on average better off, better educated and more likely to hire coaching. The gap in outcomes is not purely the school’s doing, and the gap in spending is not purely the school’s quality. Our piece on teachers who fail the test also points out that the problem lies with how teachers are trained and selected, so the best use of extra money may be in teacher training and support instead of the next building.
What do Kerala, Himachal and Delhi show?
The three states are often cited as proof that public schools can work. Each case teaches something different.
Kerala: spend steadily, and keep the school close
Kerala has been at or near the top of per-student spending in elementary education since at least the early 2010s, as an earlier Accountability Initiative paper on 2011-12 found. It is also the state where the public school is part of the village, with a long history behind it that we traced in our piece on Kerala’s education model. The state’s own budget funds most of it, so the scheme money from the Centre is a small supplement. The lesson is consistency over decades, not a scheme.
Himachal Pradesh: small classes in a small state
Himachal topped the Accountability Initiative’s list at Rs 59,499 per student in 2017-18 and had the highest approved Samagra Shiksha budget per student, Rs 9,969, in a 2020 CPR analysis. The state has few children per school and very high government school use. Both Kerala and Himachal were named in ASER 2024 coverage among states showing improvement in reading and arithmetic. The lesson is that a state with fewer children, high spending and high public school use can sustain quality. The caveat is that this does not transfer easily to a state with 21.6 million government school students.
Delhi: a big budget, and a reminder to check what is spent
Delhi’s 2024-25 budget set aside Rs 16,396 crore for education within a total of Rs 76,000 crore, which is roughly a fifth of the budget, according to Careers360. That figure covers all education, including higher and technical education, so it cannot be divided by the number of school children to get a per-seat cost. We could not find an audited per-student figure for Delhi’s government schools, so we do not offer one. A single RTI reply reported by PTI also showed that the Directorate of Education spent Rs 1,267.87 crore of Rs 2,703.12 crore allocated for general education in 2024-25. The point is a narrow one: the figure in the budget book and the figure spent are different, and anyone judging a state school system should ask for both. The wider debate about the Delhi school model, with its real gains and its trade-offs, is covered in the earlier piece linked above.
What is the real total cost of a seat?
Putting the pieces together, a government school seat costs the public purse somewhere between a few thousand rupees and a lakh or so a year, depending on the state, plus about Rs 2,863 from the family. A non-government seat costs the family about Rs 25,002 on average, and for those in expensive urban schools, far more.
The figures come from different years and different surveys, so they cannot be added into one precise number. They give a range. In a low-spending state, public money per child may be around Rs 10,000 a year. In a high-spending hill state, it may be six times that. A family choosing a private school is therefore paying out of pocket for something the state would otherwise provide at its own cost, while the state still pays for the children who remain.
This has an uncomfortable consequence. Public schools carry the children who are hardest and costliest to teach: first-generation learners, migrant families, girls in remote villages and children with disabilities. As better-off families leave, the voices that demand better schools weaken. That is the dynamic our earlier piece on the middle-class exit describes, and the cost figures here show why it is a problem of money as much as of attitude.
How should you read these cost numbers?
Per-seat figures look precise, and they are easy to misuse. Four rules keep them honest.
Check the denominator first. The CPR method divides a state’s total school spending by enrolment in government and aided schools. If a state’s enrolment falls because families move to private schools, the cost per remaining child goes up, and the state looks as if it is spending more on each child while the school system is actually shrinking. A rise in the number needs a second look at what happened to the enrolment line.
Check the year next. The state figures quoted here are for 2017-18, and the household figures are for 2025. Salary scales, fees and food prices have moved in between, so the two should be read as separate pictures, not added to each other. Where we put them side by side, it is to show scale, and the rounding is deliberate.
Look at what the survey counts. The 2025 household survey separates school expenses from private coaching, while the 2017-18 round combined them. A family that spends Rs 25,002 on school may spend several thousand more on tuition. The same survey found 27.0 percent of all students taking coaching, at an average of Rs 3,988 a year in urban areas and Rs 1,793 in rural areas, and the cost rises with each level of schooling. Those costs fall on top of the school’s own fees, whichever school the child attends.
Finally, remember who is in the sample. The urban and rural gap in the household survey is wide: course fees averaged Rs 15,143 in urban areas against Rs 3,979 in rural areas. A national average of Rs 7,111 describes almost nobody. A village child in a government school and a city child in an English-medium private school live in different cost worlds, and any policy that treats them as one group will serve neither well.
What the numbers do show, when read with care, is a system where families already carry most of the cost of their children’s schooling in cash, and the state carries the rest through salaries it pays unevenly. A government school seat is cheap for the family and expensive for the state in some places, cheap for both in others, and in too many places neither cheap nor good. The useful question for a citizen is not whether to spend more, but whether a given state’s spending reaches the classroom as a trained teacher, a working toilet and a book the child can read.
What would a better-spent rupee look like?
The evidence points to a few uses that work better than a general rise in spending.
- Fill teacher vacancies with trained, regular teachers. A school with no teacher at all costs the state nothing in salary and delivers nothing in return. Filling posts is not new spending in the usual sense. It is spending that has already been approved.
- Train teachers in the subject they teach. The 2026 audit we discussed in our piece on teacher test scores points to subject knowledge as a weak point. A training day that improves classroom practice is cheaper than a building.
- Teach reading and arithmetic first. Structured foundational literacy programmes, with clear targets for Classes 1 to 3, cost little per child and are the kind of spending the ASER reading results suggest matters most.
- Protect the meal and the toilet. Both are small in cost and large in attendance, especially for girls.
- Publish the numbers. A school-level report showing money received, money spent and teachers present would let parents and gram sabhas ask better questions.
What can you do?
- Find your school’s numbers. The UDISE+ school report card, available online for each school, shows enrolment, teachers and facilities. Compare your local school with the district average.
- Ask about the school management committee. Under the Right to Education Act, every government school has one with parent members. Ask when it last met and what it decided.
- Read the budget for your state. School education is usually among the largest lines. Find the allocation and the revised estimate and see whether they match.
- Volunteer a regular hour. Reading help for Class 2 and 3 children does measurable good, and costs the school nothing.
- Share the full cost with a parent who is deciding. A private school is not always better value. Ask to see the school’s learning results, not only its fee list.
- Press for filled posts. Write to your education officer or MLA about vacancies in your own school, with numbers.
Frequently asked questions
How much do Indian households spend on a child’s school education?The CMS Education survey 2025 found an average of Rs 2,863 per student a year in government schools and Rs 25,002 in non-government schools.
How much does the government spend on one student?It varies widely by state. In 2017-18 the Accountability Initiative found Rs 9,573 per student in Bihar and Rs 59,499 in Himachal Pradesh, among the eight states it studied. The numbers are older and cover only those states.
What is the biggest cost in a government school?Teacher salaries. They were the largest share of school expenditure in all eight states the Accountability Initiative studied.
Does higher spending per student mean better results?Not automatically. The Accountability Initiative found no clear evidence that higher per-student spending alone raises learning. How teachers are selected, trained and supported matters more.
Are private schools better than government schools?On average, more of their Class 5 children read at Class 2 level in ASER 2024 (59.3 percent against 44.8 percent in government schools). But the families differ in income and education, so the gap is not all down to the school.
How much does the midday meal cost?From December 2024 the Centre’s food-material rate is Rs 6.19 per child per day for primary and Rs 9.29 for upper primary classes. Cooking and labour costs are extra.
Why not compare Delhi’s per-student spending?The budget figure covers all education, including higher education, and we could not find an audited per-student number for Delhi’s government schools. We prefer to leave it out than to guess.
What you can do
- Share the evidenceSend this to one person who should know about education.Share on WhatsApp
- Give an afternoonTeach, mentor, clean up, or lend your professional skills.Ways to volunteer
- Tell us what's missingKnow a story, a fact we got wrong, or a solution worth spotlighting?Suggest a story
Politically neutral. Every claim sourced. Report a correction.
No comments yet